Debugging can be a nightmare for software engineers, it is even more so in the distributed systems that span many machines in potentially more than one datacenter. Unfortunately, many of the debugging and monitoring techniques for such large system do not differ much from the methods used to debug and monitor simple single-machine software. Logs are still one of the most common way to gain the insights into the operation of the software, and these logs are typically produced my each machine independently, making it next to impossible to find causal relationships between evens happening on different servers. In addition, logs must be installed in advance at development time, and altering the information collected after the system deployment can be problematic and will require additional developer time.
Pivot Tracing tries to address these issues. Pivot Tracing allows to dynamically alter what information is being collected without having to stop the system being monitored. It also introduces a happened-before join operation that allows engineers to correlate events based on their happened-before relations to each other. Despite the ability to dynamically reconfigure the system to collect different information, it still requires expert knowledge of distributed environment being monitored. Before a system can be used, engineers need to define tracepoints, or places in the code of the underlying system where monitoring and logging instrumentation can be dynamically installed by Pivot Tracing. Engineers also need to define (1) what parameters can be extracted and logged by the system, however defining the parameters system can collect is not limited to pre-launch or configuration stage, these log parameters can be modified at any time during the life-cycle of the system Pivot Tracing monitors.
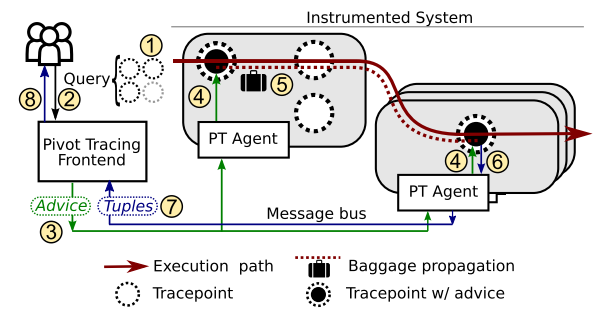
Pivot Tracing users use a high-level query language to request monitoring/debugging information they need. The query is compiled into an intermediate representation called advice. Different parameters can be collected at various tracepoints, so the advice carries the instructions to each relevant tracepoint regarding what instrumentation or monitoring needs to be installed at each tracepoint and what information is to be collected and propagated in the system. The data is collected with the execution path flow of the system, as execution passes through a relevant tracepoint (4) some parameters are collected and send down the execution path in a baggage (5). In addition tracepoints (4) can emit tuples (6) that are being sent to Pivot Tracing front end (7) will become available to the user (8).
A happened-before join, denoted by “->”, is a very powerful tool within Pivot Tracing for capturing causality of events. Let’s look at the following query example:
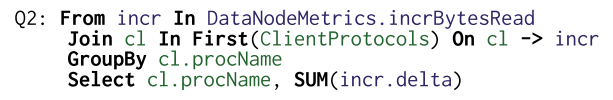
This query sets the anticipated execution path of the request. At first, a request needs to pass through a ClientProtocol and followed by the tracepoint at incrBytesRead. In the example above, we are only interested in the events that go from ClientProtocols to incrBytesRead, and any other execution paths will not work for this query. Since the query runs in parts along the execution path of the request, Pivot Tracing can easily capture happened-before relationship between events by following the request within the system. Advice compiled from the query has capabilities for evaluating messages coming in the baggage from prior tracepoints to process the happened-before joins. If the tracepoint appears earlier in the execution path, then the events at that tracepoint will happen before the events at the later tracepoint.
But what appoint non-linear execution paths? What if we have segments of code that execute in parallel? The paper does not talk about this in great details, but Pivot Tracing should still work well. For instance, if two threads are parallel and do not communicate with each other, then the events in this two threads are concurrent, however once the two threads start to communicate, the baggage from earlier tracepoints will be transmitted along these communication channels, allowing Pivot Tracing to carry out happened-before joins as usual. Consider the following example authors provide:
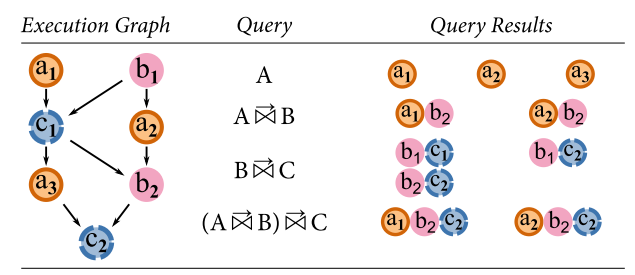
Query A -> B produces a1b2 and a2b2 results, however there is no a1b1, because at the time b1 was running, it had no baggage from the thread running a1, so both a1 and b1 are concurrent.
Pivot Tracing has been implemented in Java and tested against Hadoop software stack. Authors claim to have found a bug in HDFS by using Pivot Tracing, however by the time a bug was found with Pivot Tracing, it has already been reported by others. Nevertheless, it is impressive that the system was able to help find the problem by just executing a few small queries.
The overhead of pivot tracing is fairly small, and mainly consist of packing, unpacking and transmitting tuples from one tracepoint to another. As such, when no monitoring is required, the system can be left enabled with no queries running resulting in negligible overhead (PivotTracing Enabled row in the table below).
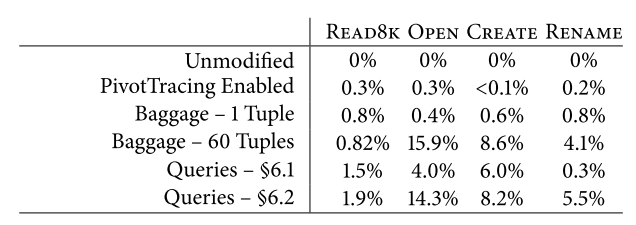
Under a stress test on the HDFS stack, the overhead reached almost 16% for certain operations. It is important to understand that some queries may result in bigger baggage transmitted and more tuples packed and unpacked to the baggage, thus, I think, it is be a good idea to test and optimize queries in staging environment before running it on the production system. This however defeats one of the bigger advantages of Pivot Tracing – its ability to dynamically adjust to different monitoring scenarios.
Authors do not talk much about scalability to system with a larger number of nodes or systems with various level of communication between different nodes. It is also interesting to see how big of a penalty will a WAN deployment incur? After all, the main overhead of the Pivot Tracing is baggage propagation and having to piggyback all that additional data to messages along the communication paths between the nodes can have severe negative effect for systems that are capable to saturate their bandwidth limitations.
Despite Pivot Tracing authors advocating against the traditional logs for debugging, their system is still fundamentally a logging system, albeit a lot more sophisticated. Users can use Pivot Tracing to log only the information they need along with some causal relationship between these log pieces. Despite this, I believe there are still cases when a traditional logging approach can be of more use than Pivot Tracing, namely debugging rare and subtle bugs that can happen only under certain set of conditions. With Pivot Tracing users can install instrumentation after such rare bug has occurred, but there is no guarantee that it will happen again anytime soon, yet the overall system pays the penalty overheads of the monitoring. In this context, traditional logs can provide more immediate benefit, as they allow engineers to look back in time at the system execution.
With the presence of back-in-time snapshot capability, we can revert back to the past states of the system and replay back the changes along with newly installed instrumentation for monitoring, but overheads of this may be enormous for a large scale distributed system. Is there a way around this? Can we look back in time and identify the bugs, data corruption or performance issues without paying a significant performance price?