Authors of the ICDCS2017 milliScope paper attack an interesting monitoring problem for distributed systems: detecting and determining a cause of short-lived events in the system. In particular, they address the issue of identifying very short bottlenecks (VSBs) in distributed web services. VSBs manifest themselves as performance degradation of a small number of requests, however they are intermittent, short-lived and hard to detect with tools that aggregate or sample performance data.
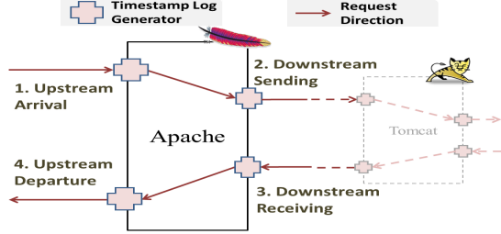 MilliScope is a monitoring solution aimed exactly at detecting such short bottlenecks and finding their root-cause. For the detection part, milliScope relies on the Event mScopeMonitors. These monitors are present at every component of the web service and record the timestamps associated with each request entering and leaving a particular component. In total, 4 local timestamps are recorded per component, 2 on the forward pass of the request and 2 on the return. This classical request tracing approach captures causal information about request propagation through the components, and it is sufficient to pinpoint the exact request and the exact component experiencing a slow-down.
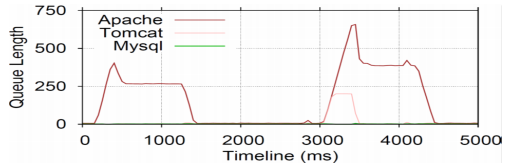 In order to provide more information about the cause of the bottleneck, milliScope uses Resource mScopeMonitors. Resource monitors use existing performance monitoring tools to log the metrics, such as CPU utilization, memory usage, I/O usage, etc. MilliScope then transforms the performance logs to a common, structured format, adding some extra support information. The data from both the event and resource mScopeMonitors eventually ends up in a warehouse and can be queried by the users. Users can overlay the data from different monitors onto each other, allowing to better identify what component or components were causing the bottleneck and what was the root cause behind the slowdown. An example of such overlaying is shown in the figure on the left, where the queue lengths of different components are shown on the same graph.
Some Critical Questions
The paper claims that existing monitors have too much overhead and thus cannot capture all requests and find the bottlenecks, however event mScopeMonitor is a simple request tracer that is no different from many others, so it is not clear why it should perform better.
MilliScope collects lots of performance monitoring data in different logs and then brings the data to a centralized location for storage and processing. Authors never mentioned in the paper how they address clock uncertainty between all these different logs. Do they require clock sync, such as NTP? Even though the event monitors capture causal relationship within the same request, resource monitors seem to rely on physical time. The authors claim that milliScope can detect and help explain bottlenecks as short as 10 ms, but what will happen if the resource monitors are skewed more than 10 ms? How accurate is milliScope going to be? In fact, both case studies in the paper worked with the bottlenecks of hundreds of milliseconds or more.
And finally, what can we do once we detected a very short bottleneck? Since VSBs are so short-lived, there may not be any time to react to their presence. Maybe a next step would be to look for precursors to the bottlenecks, so we can rebalance the system or prepare it in some other way for an incoming performance hiccup?